VEQT vs XEQT
January 16, 2026
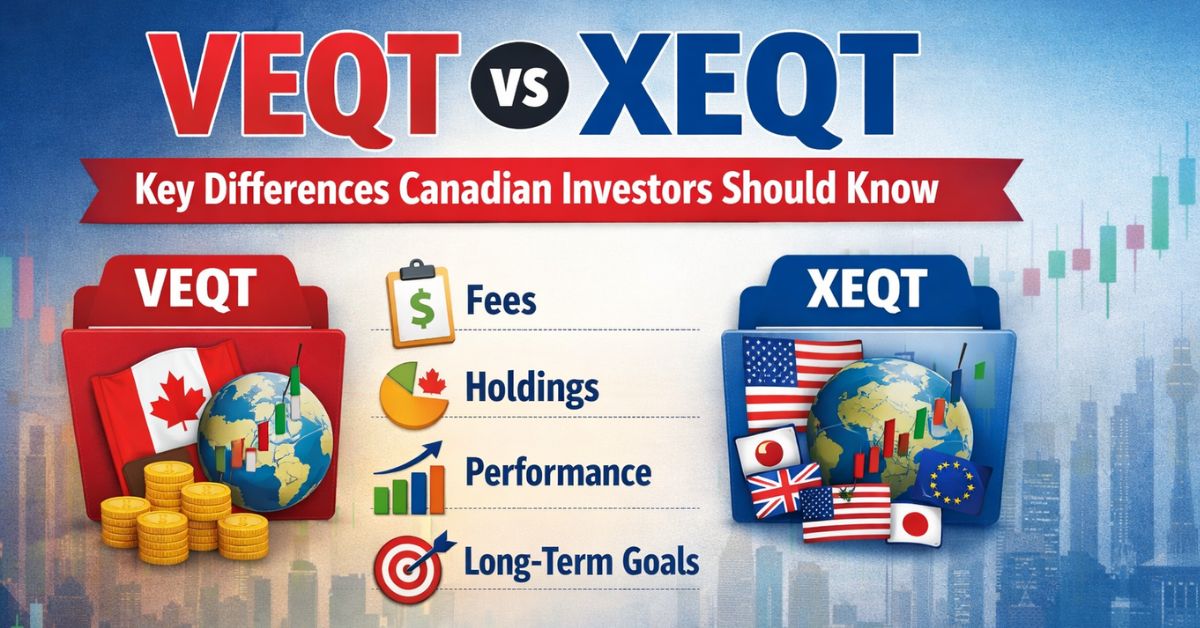
Deciding between VEQT and XEQT can feel like a big choice for Canadian investors wanting a simple, all-equity portfolio. Both aim to give you broad exposure to global stock markets in one package. But they aren’t the same. There are some differences in how they’re built, what they cost, and where they put their money. Let’s break down the veqt vs xeqt situation so you can figure out which one might fit your investment style better.
So, you’re a Canadian investor looking at your options for a simple, all-in-one investment. Two names that pop up a lot are VEQT and XEQT. Both are designed to give you a broad mix of global stocks without you having to pick individual companies or even individual ETFs. Think of them as a “set it and forget it” kind of deal for your stock market exposure.
These aren’t just simple stock funds, though. They’re actually “funds of funds,” meaning they hold other ETFs that, in turn, hold thousands of individual stocks from all over the world. This gives you a ton of diversification right out of the box. The big question for many is how these two giants differ and which one might fit your personal investment style better.
Here’s a quick look at what they offer:
It might seem like they’re pretty much the same, and in many ways, they are. But there are some subtle differences in how they’re put together, from the indexes they track to the exact percentages they allocate to different regions. Understanding these nuances can help you make a more informed choice for your portfolio.
When you’re looking at ETFs like VEQT and XEQT, you’re essentially buying a pre-made, diversified portfolio. The goal is to simplify investing and provide broad market exposure, but the specific choices made by the fund managers about what to include and in what amounts can lead to different outcomes over time.
So, what exactly are VEQT and XEQT? Think of them as super-diversified investment baskets, but with a twist: they hold only stocks. These are known as “all-equity” Exchange Traded Funds (ETFs). Instead of buying individual stocks yourself, you’re essentially buying a piece of a fund that already owns a massive collection of stocks from all over the world. This approach is generally for folks looking for potentially bigger growth over the long haul, and who are okay with the ups and downs that come with the stock market.
Both VEQT and XEQT are built using a “fund of funds” structure. This means they don’t directly own individual company stocks. Instead, they own other ETFs. This might sound a bit complicated, but it’s how they achieve such broad diversification across different markets and sectors without you having to manage a huge number of individual holdings.
Here’s a quick look at what that means in terms of sheer numbers:
While the exact number of holdings can change, the core idea is the same: massive diversification within a single ETF.
These all-equity ETFs are designed to give you exposure to the global stock market in one go. They aim for long-term growth by investing in companies across various countries and industries. It’s a way to get broad market participation without picking individual winners.
If you’re considering these ETFs, it’s good to know they are built to be a complete investment solution for your equity exposure. They aim to capture market returns rather than trying to beat the market through active stock picking.

It’s no surprise that VEQT and XEQT come up a lot when Canadian investors chat about ETFs. Both are designed as ‘all-in-one’ solutions, meaning they aim to give you broad exposure to global stock markets in a single package. This simplicity is a big draw for folks who want to invest without picking individual stocks or managing multiple funds.
Think of it this way: instead of buying separate ETFs for Canadian stocks, U.S. stocks, and international stocks, you can just buy VEQT or XEQT. They do the heavy lifting for you.
Here’s a quick look at what makes them so popular:
Because they offer similar goals – global stock market exposure in one convenient fund – investors naturally compare them. It often comes down to the finer details, like how they slice up the world’s markets and the small differences in their costs. Understanding these nuances helps you pick the one that best fits your personal investment plan. Many investors look at these types of funds as a core part of their long-term investment strategy.
The core appeal of both VEQT and XEQT lies in their ability to provide instant global diversification. They are built for investors who want a set-it-and-forget-it approach to owning stocks from around the world, simplifying the investment process significantly.
When you look under the hood of VEQT and XEQT, you’ll see they’re built using other Exchange Traded Funds (ETFs). This means they don’t directly own individual stocks in most cases, but rather own shares of other funds that, in turn, hold the stocks. The key difference here lies in which underlying ETFs they choose and, consequently, which index providers those ETFs follow.
VEQT, managed by Vanguard, primarily uses Vanguard’s own ETFs. These ETFs are designed to track broad market indexes. Think of it like this: Vanguard has its own way of measuring the stock market, and VEQT’s underlying funds aim to mirror those measurements.
XEQT, on the other hand, is managed by BlackRock (iShares). Similarly, XEQT’s building blocks are iShares ETFs. These ETFs track indexes provided by companies like MSCI and FTSE Russell, which are major players in creating global benchmarks for investment performance. So, while both are aiming for broad equity exposure, the specific indexes they track can lead to subtle differences in their holdings.
Here’s a simplified look at the main index providers involved:
The choice of index provider isn’t just a technical detail; it shapes the exact mix of stocks and regions each ETF holds. It’s how they decide what ‘the market’ looks like and how they aim to replicate it.
This difference in index tracking is a big reason why you’ll see slight variations in their geographic and sector allocations, which we’ll get into more detail about later. It’s not about one being ‘better’ than the other, but about how their underlying strategies, dictated by these index providers, play out in the real world. For instance, the iShares Core S&P/TSX Capped Composite Index ETF, one of the types of funds that might be held within a Canadian equity allocation, has shown solid performance in November.
When you’re looking at VEQT and XEQT, one of the first things that jumps out is how they spread their investments across different parts of the world. It’s not just about owning stocks; it’s about where those stocks are located. This geographic split can really impact your portfolio’s performance and risk.
Both ETFs aim for global diversification, but they go about it with slightly different priorities. Think of it like two chefs using similar ingredients but adjusting the recipe to get a slightly different flavor.
Here’s a general breakdown of where they put their money:
Here’s a snapshot of how their regional allocations looked recently:
| Region | VEQT | XEQT |
| United States | 44.9% | 44.74% |
| Canada | 30.5% | 24.55% |
| Europe | 10.8% | 11.39% |
| Other Developed Regions | 7.2% | 12.76% |
| Emerging Markets | 6.3% | 5.12% |
The choice between VEQT and XEQT often comes down to how much you want to tilt your portfolio towards your home country versus other developed or emerging economies. While both offer broad global exposure, these differences in geographic weighting mean they aren’t identical twins. Understanding these nuances is key for Canadian investors making their selection.
So, if you’re looking for a bit more Canadian flavor and a stronger bet on emerging markets, VEQT might appeal. If you prefer a slightly heavier hand in developed international markets and a more modest Canadian allocation, XEQT could be your pick. It’s all about aligning with your personal investment strategy.
When we look at VEQT and XEQT, a big part of what makes them tick is how much Canadian stock they hold. It’s a common point of comparison for Canadian investors because, well, we live here! Both ETFs are designed to give you a slice of the global market, but they do have slightly different ideas about how much of “home” should be in the mix.
VEQT tends to hold a bit more Canadian equity compared to XEQT. This isn’t a massive difference, but it’s there. For some investors, this might mean a slightly different risk and return profile, especially when the Canadian market is doing its own thing compared to the rest of the world.
Here’s a quick look at the general allocation, though remember these numbers can shift:
This difference is mainly because VEQT uses different underlying ETFs. For instance, it might hold a dedicated Canadian equity ETF that has a larger weighting than what XEQT’s underlying funds provide. It’s all about how the portfolio managers decided to slice the pie.
The decision to hold more or less Canadian equity often comes down to a few factors. Some investors like the familiarity and potential tax advantages of holding Canadian stocks directly. Others prefer to let global market cap dictate the allocation, which naturally leads to a smaller Canadian weighting because Canada is a smaller part of the overall global stock market. It’s a balancing act between home bias and global diversification.
So, while both ETFs give you Canadian exposure, VEQT leans a little more into it. If you’re looking to tilt your portfolio more towards Canadian companies, VEQT might catch your eye. If you’re happy with a slightly smaller, market-cap-driven slice of Canada, XEQT fits the bill. It’s worth checking the latest fund fact sheets for the most up-to-date percentages, as these allocations aren’t set in stone and can change based on market conditions and the underlying ETFs’ strategies. You can find more details on these types of global stock funds on pages like iShares Core MSCI All Country World ex-Canada Index ETF.
When you look at VEQT and XEQT, a big chunk of their investments is in the United States. It makes sense, right? The U.S. stock market is huge and has a lot of well-known companies. Both ETFs recognize this and put a significant portion of your money there.
Here’s a general idea of how they stack up:
So, you can see they’re pretty close on this front. The U.S. market represents the largest single geographic allocation for both of these all-equity ETFs. This isn’t a surprise, given the sheer size and influence of the American economy and its stock exchanges on the global stage.
Why so much U.S. exposure? Well, it’s largely driven by market capitalization. The U.S. stock market makes up a massive portion of the total global stock market value. When these ETFs aim to track global markets by market cap, a large slice naturally goes to the U.S.
It’s worth noting that while both ETFs have similar U.S. allocations, the specific companies and the underlying ETFs they hold to achieve this exposure can differ. This means the exact companies you own a piece of might vary slightly between VEQT and XEQT, even if the overall percentage is the same.
This heavy U.S. weighting means that the performance of the American stock market will have a pretty big impact on how VEQT and XEQT do overall. If the U.S. market is booming, you’ll likely see that reflected in your ETF’s returns, and vice versa.

When we look beyond North America, VEQT and XEQT take slightly different approaches to international and emerging markets. Both ETFs aim for global diversification, but the specific allocations do vary. It’s not just about owning stocks from different countries; it’s about how much of each region gets included in the portfolio.
VEQT tends to put a bit more weight into emerging markets compared to XEQT. For instance, as of late 2024, VEQT might allocate around 7% to emerging markets, while XEQT might be closer to 5%. This difference might seem small, but over time, it can add up. Emerging markets can offer higher growth potential, but they also come with more risk and volatility. This is a key area where investors might see a divergence in performance, especially during periods when emerging markets are outperforming or underperforming developed markets.
Here’s a general look at how they stack up:
It’s worth noting that the exact number of holdings can be a bit misleading. While VEQT might list more individual stocks in its emerging markets component, some of these can be different share classes of the same company. After accounting for these, the actual diversification might be closer than the raw numbers suggest. Still, the weighting given to these regions is what really matters for the overall portfolio.
The decision between VEQT and XEQT often comes down to your comfort level with emerging market risk and your outlook on their potential growth. If you’re looking for a slightly higher tilt towards these potentially faster-growing but riskier markets, VEQT might appeal more. If you prefer a more conservative approach to international exposure, XEQT’s allocation could be more suitable. You can check the latest fund facts for the most up-to-date allocation details on the iShares Core Equity ETF Portfolio website.
When you look at VEQT and XEQT, they’re both designed to be pretty hands-off for investors. They aim to give you broad exposure to global stock markets all in one package. But how they actually put that together and keep it on track is where things get a little different.
Both ETFs hold other underlying ETFs to achieve their diversification. Think of it like a fund of funds. This structure means they’re automatically diversified across different regions and sectors.
The main difference lies in how strictly they stick to their target allocations and how they rebalance.
Here’s a general idea of their approach:
Essentially, both ETFs are built to be globally diversified and automatically rebalanced. VEQT has a more defined, tighter rebalancing band for its underlying components, while XEQT’s approach is also systematic but perhaps with a bit more flexibility in its execution. For the average investor, this difference is unlikely to be a major deciding factor, as both are designed to keep your portfolio aligned with their global equity mandate without you having to lift a finger.
When you’re looking at ETFs like VEQT vs XEQT, one of the first things that often catches an investor’s eye is the cost. This usually comes down to the Management Expense Ratio, or MER. Think of the MER as the annual fee you pay to the fund manager for running the ETF. It might seem small, but over many years, even a tiny difference can add up.
XEQT generally has a slightly lower MER than VEQT.
Here’s a quick look at the typical MERs:
| ETF | Management Fee | MER (Approx.) |
| VEQT | 0.22% | 0.24% |
| XEQT | 0.18% | 0.20% |
So, what does this mean in practice? For every $10,000 invested, XEQT might cost you around $20 per year, while VEQT could be closer to $24. It’s not a huge gap, but for investors putting in substantial amounts or holding for decades, that extra $4 per $10,000 annually could become noticeable.
It’s important to remember that MER isn’t the only cost. There are also trading costs when buying and selling, and potential currency conversion fees if you’re dealing with foreign assets. However, the MER is the ongoing operational cost that impacts your returns year after year.
The MER covers all the behind-the-scenes work: managing the investments, keeping records, paying auditors, and all the other bits and pieces that keep the fund running smoothly. While both ETFs are designed to be cost-effective, XEQT’s slightly leaner fee structure is a point of consideration for many.
When you invest in an ETF like VEQT or XEQT, you’re essentially buying a basket of stocks. Many of those stocks pay dividends, and the ETF passes those dividends on to you. So, how do these two popular all-equity ETFs stack up when it comes to dividend income?
Both VEQT and XEQT aim to provide broad market exposure, and as such, they will generate dividend income from their underlying holdings. The actual yield you receive can fluctuate based on market conditions and the specific companies within the portfolios at any given time. It’s not usually the primary focus for investors choosing these types of total return ETFs, but it’s still something to be aware of.
Here’s a general look at what you might expect:
It’s important to remember that the total return of an ETF comes from both capital appreciation (the stock price going up) and dividend distributions. For long-term investors focused on growth, the capital appreciation aspect is usually more significant than the dividend yield itself.
When you’re looking at ETFs like VEQT and XEQT, thinking about taxes is pretty important, especially depending on where you hold them. It’s not just about the returns; it’s about what you actually get to keep after Uncle Sam takes his cut.
For most Canadians, the best place to hold these kinds of investments is in registered accounts like RRSPs or TFSAs. Why? Because in these accounts, you generally don’t pay taxes on the dividends or capital gains as they happen. It’s like a tax shelter for your investments, letting your money grow without that yearly tax drag. This is a big deal for long-term growth.
When you hold these ETFs in a non-registered account, things get a bit more complicated. You’ll likely receive Canadian-domiciled ETFs, which are designed to be more tax-efficient in taxable accounts. However, there are still some tax implications to consider:
The way these ETFs are structured, particularly their holdings in U.S. equities, means that holding them in a registered account is usually the most straightforward and tax-advantageous approach for Canadian investors. Non-registered accounts require a bit more attention to tax details.
Here’s a quick look at how the underlying holdings might affect things:
| Region | VEQT Approx. Allocation | XEQT Approx. Allocation | Tax Consideration |
| Canada | 30% | 25% | Generally tax-efficient in taxable accounts. |
| U.S. | 45% | 45% | Potential for U.S. dividend withholding tax. |
| Developed Ex-North | 18% | 24% | Subject to foreign dividend withholding taxes. |
| Emerging Markets | 7% | 5% | Subject to foreign dividend withholding taxes. |
Ultimately, for most people, the tax benefits of holding broad market ETFs like VEQT and XEQT in registered accounts far outweigh any minor differences between the two in taxable accounts. It simplifies your tax situation and lets your investments grow more effectively.
Liquidity and Trading Volume
When you’re looking at ETFs like VEQT vs XEQT, it’s good to think about how easily you can buy and sell them. This is basically what liquidity and trading volume are all about. For most Canadian investors, especially those just buying and holding for the long haul, this isn’t usually a huge concern. Both VEQT and XEQT are pretty popular, so they generally trade without much fuss.
The key takeaway is that both ETFs are highly liquid and have strong trading volumes, making them accessible for most investors.
Here’s a quick look at some numbers, though keep in mind these can change:
| Metric | VEQT (Vanguard All-Equity ETF Portfolio) | XEQT (iShares Core Equity ETF Portfolio) |
| Average Daily Volume (approx.) | ~500,000 – 1,000,000 shares | ~700,000 – 1,200,000 shares |
| Assets Under Management (AUM) | ~CAD 5.14 Billion (as of Sep 20, 2024) | ~CAD 4.77 Billion (as of Sep 20, 2024) |
These figures suggest that XEQT might see a bit more action on a typical day, but VEQT is also very active. The AUM also shows that both are substantial investments, which usually translates to good liquidity.
Why does this matter?
For the average Canadian investor planning to hold these ETFs for years, the day-to-day fluctuations in trading volume are unlikely to be a major factor in their investment decision. Both ETFs are managed by major players (Vanguard and iShares) and are listed on the Toronto Stock Exchange, which ensures they are readily available and easy to trade.
So, while it’s good to be aware of liquidity, don’t let minor differences in trading volume sway your decision between VEQT and XEQT if other factors align better with your investment goals.
When we look at how VEQT vs XEQT have performed over time, it’s pretty clear they’re in the same ballpark. Both are designed to give you broad exposure to global stocks, so their ups and downs tend to mirror each other.
Historically, their returns have been very close. For example, looking at data up to late 2024, their average annual returns over one, three, and five years are almost identical. Sometimes one might edge out the other by a tiny fraction, but it’s not enough to make a big difference for most investors.
Here’s a quick look at some trailing returns:
| Period | VEQT | XEQT |
| 1 Year | 21.14% | 21.33% |
| 3 Years | 7.46% | 7.56% |
| 5 Years | 11.57% | 11.77% |
The risk profile for both ETFs is essentially the same: high. Since they are 100% invested in equities, they carry the full volatility of the stock market. This means you can expect significant swings in value, especially over shorter periods. They aren’t designed for someone who wants a smooth ride; they’re for investors looking for long-term growth and who can handle the bumps along the way.
Because both ETFs are fully invested in stocks, their risk is tied directly to how the global stock market performs. There’s no cushion from bonds or other less volatile assets. This means that during market downturns, you can expect both VEQT and XEQT to lose value, potentially significantly. However, over the long haul, stocks have historically provided higher returns than other asset classes, which is the trade-off for this higher risk.
In short, if you’re comparing VEQT vs XEQT based on past performance and risk, you’re looking at two very similar options. The slight differences you might see are usually too small to be a deciding factor for most people. The main thing to remember is that both are all-equity investments, meaning they come with the inherent risks and potential rewards of the stock market.
So, you’ve looked at VEQT vs XEQT, and you’re wondering which one is the better fit for your investment goals. Honestly, if you’re at the stage where an all-equity ETF makes sense for you, both of these are pretty solid choices. It’s not like one is a clear winner and the other is a total dud.
Think about it this way:
Ultimately, the differences between VEQT vs XEQT are pretty minor. They both hold thousands of stocks across the globe, and their performance has been very similar historically. It often comes down to small preferences like the exact allocation percentages or that tiny MER difference.
The decision between VEQT vs XEQT often boils down to personal preference rather than a stark performance difference. Both offer excellent diversification and are built for long-term investors who can handle market volatility. Don’t overthink it too much; pick the one that feels right for you and stick with it.

When you’re trying to decide between VEQT vs XEQT, it helps to lay out the good and the not-so-good points for each. Both are designed to give Canadian investors a simple way to own a piece of the global stock market, all in one ETF. But they do have their differences, and understanding them can make all the difference for your portfolio.
Here’s a quick rundown:
VEQT Pros:
VEQT Cons:
XEQT Pros:
XEQT Cons:
Ultimately, the choice between VEQT and XEQT often comes down to subtle differences in their underlying index providers and how they weight different regions. Both are excellent, all-equity, globally diversified ETFs designed for Canadian investors. The decision often hinges on whether you prefer a slightly higher Canadian weighting (VEQT) or a slightly lower MER and a weighting closer to global market caps (XEQT). The performance differences between VEQT and XEQT have historically been very small, so don’t overthink it too much.
When comparing VEQT vs XEQT, remember that both offer a fantastic, hands-off approach to global equity investing. The key is picking the one that best fits your personal preferences regarding Canadian exposure and cost.
So, you’re looking at VEQT and XEQT for the long haul, huh? That’s a smart move. Both of these are designed to be pretty much set-it-and-forget-it options for Canadians who want broad stock market exposure without picking individual companies. They’re built to grow with you over decades, which is exactly what you want for retirement or other big future goals.
When you’re thinking long-term, the small differences between them might not seem like a big deal day-to-day, but over 20, 30, or even 40 years, they can add up. It really comes down to what kind of tilt you prefer in your portfolio. Do you want a bit more Canadian flavor, or are you okay with a slightly heavier U.S. weighting?
Here’s a quick look at how they stack up on some key points for the long haul:
The biggest thing for long-term investing is sticking with it. Both VEQT and XEQT are built for exactly that. They handle the rebalancing and diversification for you, so you can focus on saving and letting your money work.
Ultimately, choosing between VEQT vs XEQT for your long-term strategy is less about which one is ‘better’ and more about which one aligns with your personal preferences. Since they both offer excellent global diversification and are managed passively, you can feel confident choosing either one. You can check out the iShares Core Equity ETF Portfolio for more details on XEQT’s structure.
Thinking about which ETF is best for your long-term Canadian investments? Section 17 dives into the differences between VEQT and XEQT. It’s a big decision for your future! Want to learn more about making smart investment choices? Visit our website today for more helpful articles and guides.
Think of VEQT and XEQT as big baskets that hold lots of other smaller baskets, and those smaller baskets hold stocks from all over the world. They are designed for investors who want to own a piece of many companies without having to pick them individually. Both are all-equity ETFs, meaning they mostly invest in stocks, aiming for growth but also carrying more risk than funds that include bonds.
These two ETFs are super popular in Canada because they offer a simple way for Canadians to invest globally. They are ‘all-in-one’ solutions, meaning you get a diversified portfolio with just one purchase. Since they are both focused on owning stocks worldwide, people naturally compare them to see which one might be a better fit for their investment goals.
No, they are managed by different big investment companies. VEQT is from Vanguard, a well-known name in the investing world. XEQT is from iShares, which is part of BlackRock, another major player. Both companies are reputable and have a long history of managing investments.
They both invest globally, but with slightly different focuses. XEQT tends to put a bit more money into the U.S. market and less into Canada compared to VEQT. VEQT puts a little more emphasis on Canadian stocks and emerging markets. However, both have a large chunk in the U.S. because it’s such a huge part of the global stock market.
VEQT generally holds a larger portion of Canadian stocks, around 30-31%. XEQT typically has a smaller slice of its investments in Canada, closer to 24-25%. This difference is one of the key distinctions people look at when choosing between them.
Both ETFs invest heavily in the U.S. stock market because it’s the largest in the world. XEQT usually has a slightly higher allocation to the U.S., around 44-45%, while VEQT is very close, often around 44-45% as well. This is a significant part of their portfolios.
Yes, they do! Besides the U.S. and Canada, both ETFs invest in stocks from developed countries outside North America (like in Europe and Japan) and also in emerging markets (like China, India, and Brazil). VEQT usually puts a bit more into emerging markets than XEQT.
Rebalancing is how the ETFs keep their investment mix on track. Both ETFs automatically rebalance to maintain their target allocations. Vanguard (VEQT) has a rule where a specific investment type can’t drift more than 2% from its target. iShares (XEQT) also rebalances, but the exact triggers might differ slightly. They often use new money coming in to rebalance, which is efficient.
Both have low fees, which is great for long-term investors. XEQT generally has a slightly lower management fee (MER) than VEQT. The difference is very small, maybe 0.04% per year, but over many years and with a lot of money, it can add up. However, both are considered very cost-effective.
Historically, their performance has been very similar. Sometimes one might be slightly ahead of the other, often due to how much they invest in Canada versus the U.S. or international markets in a given year. For the long run, experts expect their performance to be nearly identical.
It really depends on your personal preference. If you want slightly more Canadian exposure and don’t mind a slightly higher fee, VEQT is a solid choice. If you prefer a slightly lower fee and a bit more U.S. and international exposure, XEQT might be better. Honestly, the differences are minor, and either can be a great option for a diversified, all-equity portfolio.
Yes, they can be! Because they are ‘all-in-one’ funds, they offer instant diversification across many companies and countries. This simplifies investing a lot. However, remember they are ‘all-equity,’ meaning they are riskier and best suited for investors who have a long time horizon and can handle market ups and downs.